Recruitment ROI is a measurement problem, not a math problem: the 4 inputs that turn hiring into a P&L line

Most "recruitment ROI" articles give you the same formula. Net benefit divided by total cost, times one hundred. Plug in your numbers, present to the CFO, done. Except the CFO will ask one follow-up question that breaks the entire exercise: how do you know the value side of the equation is real?
That is the part most ROI guides skip. The math is fine. The inputs that feed the math are not. They are estimates wrapped in confidence: the value of a hire, the cost of a vacancy, the productivity of a new joiner, the retention odds. When the four inputs are guesses, the ROI number is theatre - a finance-shaped artifact that nobody outside recruiting believes.
Recruitment ROI is a measurement problem, not a math problem. Until the inputs are real, the formula is just decoration. This piece walks through the four inputs that actually turn hiring into a P&L line, and how to instrument each one so the conversation with finance stops being a vibes-based exercise.
The formula isn't the problem, the inputs are
The textbook formula is straightforward. Recruitment ROI equals net benefits of hiring divided by total recruiting costs, multiplied by 100. Net benefits equals the value generated by hires minus what it cost to find and onboard them. Total recruiting costs covers sourcing, tools, recruiter salaries, ads, assessments, onboarding.
It is the right shape. It is also the wrong fight. Recruiting teams who present this formula to leadership rarely lose on the math. They lose on the value-generated side. How exactly did this hire generate $180,000? Was it the role, the calibre of the person, or the fact that the previous person in the seat left a backlog the new hire happened to clear? Finance teams are not satisfied with "we picked a good one" because they cannot replicate it next quarter.
The credibility gap is structural, not anecdotal. According to Metaview's 2026 AI & Hiring Alignment Report - surveying 505 recruiting leaders and hiring managers across North America and EMEA - the working relationship between recruiting and hiring managers gets rated as good or excellent 90% of the time, yet 58% of teams routinely contemplate working around their counterpart entirely. The surface story and the operational reality are not the same thing. Any ROI calculation built on top of that gap will inherit it.
The four inputs below are the ones the formula needs in order to stop being theatre. Each one can be instrumented without buying new software, but they all require treating the interview layer as a data source rather than a memory aid.
The 4 inputs that turn hiring into a P&L line
The four inputs that change ROI from guess-work to P&L are not exotic. They are the things every recruiting leader already talks about. The difference is that they can be instrumented - measured, surfaced, fed back into the formula - rather than estimated in a quarterly review.
Each input maps to a different ROI lever. Speed of decision moves the time-to-revenue clock. Quality of signal raises the predictive validity of who you hire. Candidate experience compounds into first-year retention. Hiring-manager confidence is the leading indicator that tells you whether your process is actually working, weeks before the lagging metrics arrive.
Hours and days between an interview and the next step. Compresses the funnel and stops faster-moving competitors winning offers by default.
Whether interviews actually surface the competencies you need. Without it, you are picking on charm and recall, not evidence.
How well the process treats people through to offer. Drives first-year retention, referrals, and offer acceptance.
Whether HMs trust the recruiter and the data. Predicts business-goal attainment weeks before the lagging metrics do.
Input 1: Speed of decision (and the dollars that bleed when you don't have it)
Speed is the input with the most direct dollar tie. If a role generates $200,000 of business value a quarter, every week it sits open costs about $15,000. Every week shaved off the funnel adds back that same amount. The Alignment Report's 67% headline - teams losing qualified candidates to faster movers every month - is exactly this lever, just expressed in lost-opportunity terms instead of dollars.
The bottleneck is rarely sourcing or scheduling. Most funnels stall at the decision points: the gap between the interview and the debrief, the gap between the debrief and the hiring-manager call, the gap between the verbal yes and the offer letter. Those gaps exist because the data needed to make the decision is locked in interviewer memories and half-finished scorecards, not in a system anyone else can read.
Closing those gaps is the cheapest ROI move in the funnel. It requires no new headcount and no new tooling category - just making the interview output structured enough that the next person in the chain can act on it inside the same day. Recruiters who do this stop spending time chasing feedback and start spending it advancing candidates.
The initial ROI is clear. We've seen an improvement in how many calls recruiters can do per day because the process is streamlined.”
Input 2: Quality of signal (and the predictive validity gap)
Quality of signal is the input that hits ROI hardest because it compounds. A hire made on weak signal does not just cost the recruitment spend - it costs the year of underperformance, the replacement cycle, the team-morale tax, and the role-credibility hit with the hiring manager. Most teams know this. Few measure it.
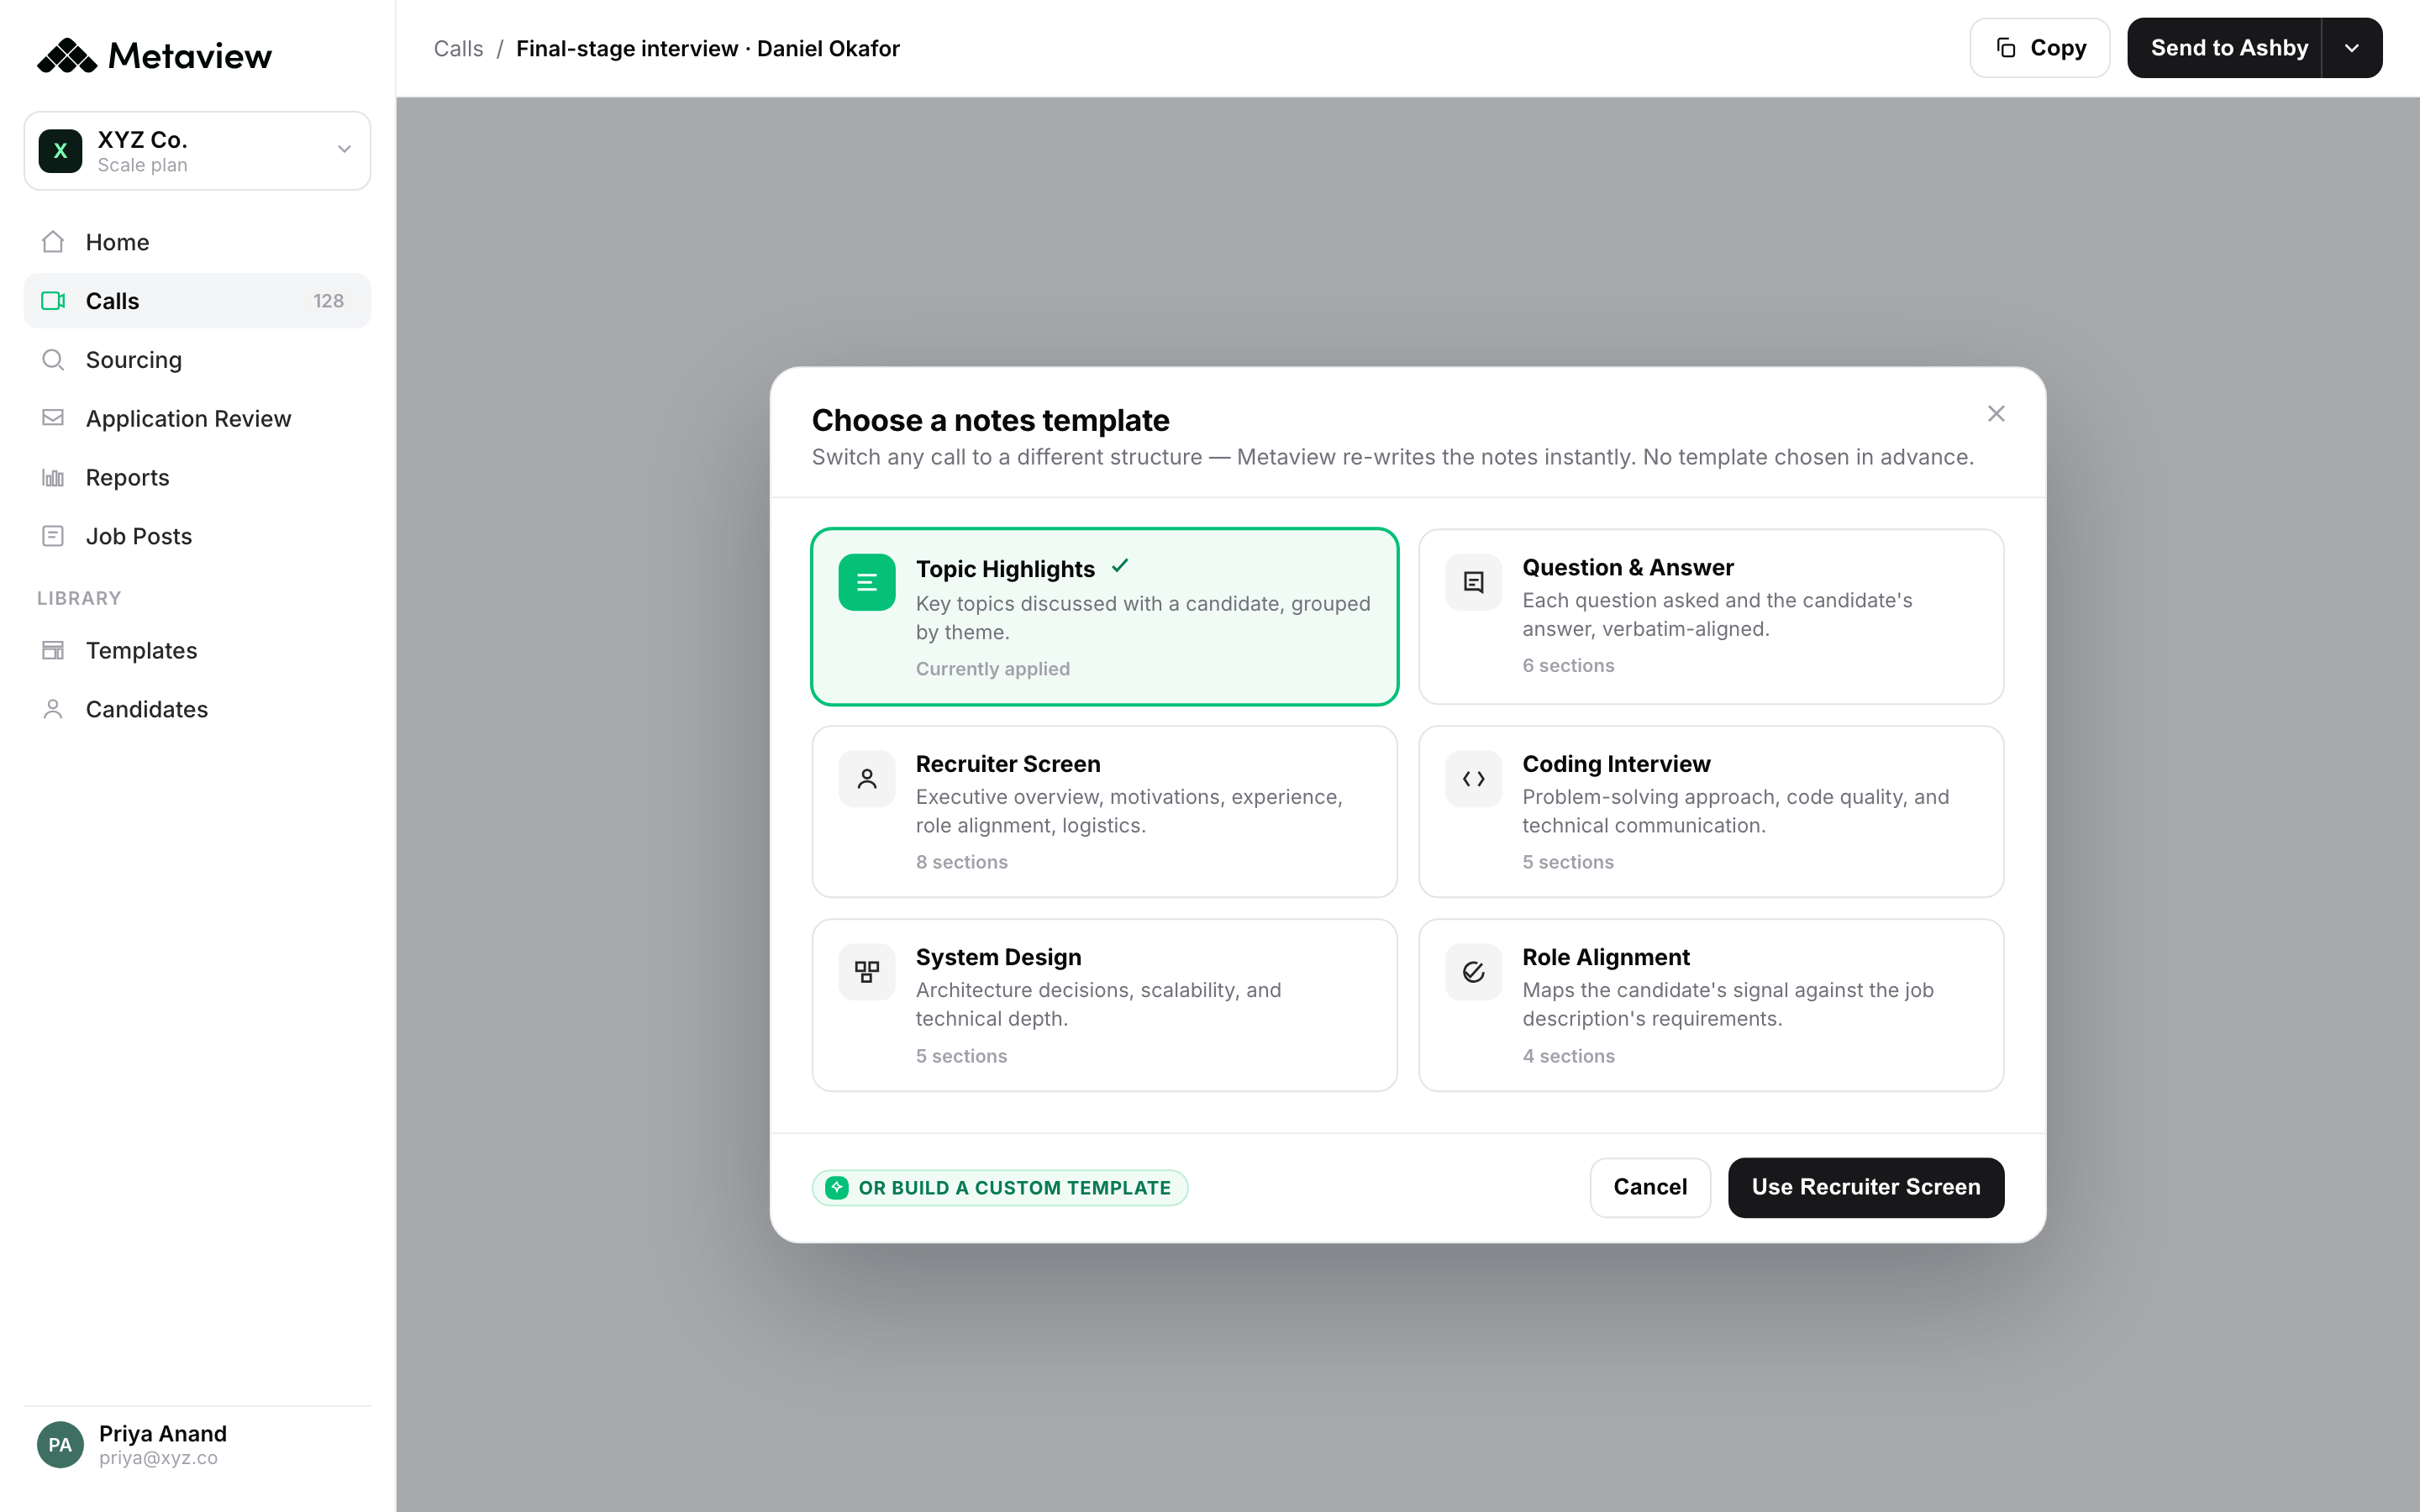
The gap is not a lack of competency frameworks. It is the distance between the framework and the actual interview. A scorecard with eight criteria does not help if the panel only asked about two of them, and the post-interview write-up was three bullets typed during the next meeting. The framework looks rigorous on paper. The signal it actually captures is closer to a guess.
The shift is from did this person feel right to which competencies did the conversation actually cover, and what did the candidate say about each one. That answer exists in every interview. It just usually evaporates within an hour of the call ending.
- Spreadsheet-derived cost per hire, no audit trail back to source data
- Quality assessed through retention 12+ months after the hire
- Hiring-manager satisfaction polled quarterly, treated as anecdotal
- Speed reported as a single number, not segmented by funnel stage
- When finance asks “how do you know?” the answer is “trust me”
- Per-hire cost tied to specific sourcing channels and recruiter time
- Quality scored on competency-by-competency interview evidence
- Hiring-manager confidence captured per role, surfaced in dashboards
- Stage-by-stage cycle time, with bottleneck attribution
- When finance asks “how do you know?” the answer is “here's the audit trail”
Input 3: Candidate experience-driven retention
Candidate experience is the input most teams underweight because it pays back slowly. A great-experience candidate who accepts the offer is more likely to stay through year one, refer others into the funnel, and join with higher trust in their manager. A poor-experience candidate who still accepts arrives with a deficit that needs to be paid down before they produce. The dollar value of that difference is real, just deferred.
The retention-ROI link runs through the interview itself. Candidates form most of their impression of a company from the way the interview panel treats them - whether interviewers listened, whether questions were thoughtful, whether feedback came back fast. When recruiters have to type notes and ask follow-up questions at the same time, the experience suffers in a way the candidate can feel.
Surfacing this in the ROI model means moving from a single end-of-process survey to per-interview signal. Were the interviews on time? Were the questions consistent with the role? Did the candidate get a substantive answer to their questions? Teams that capture this find that the experience leakage is concentrated in a small number of interviewers and stages, which is far easier to fix than “general candidate experience.”
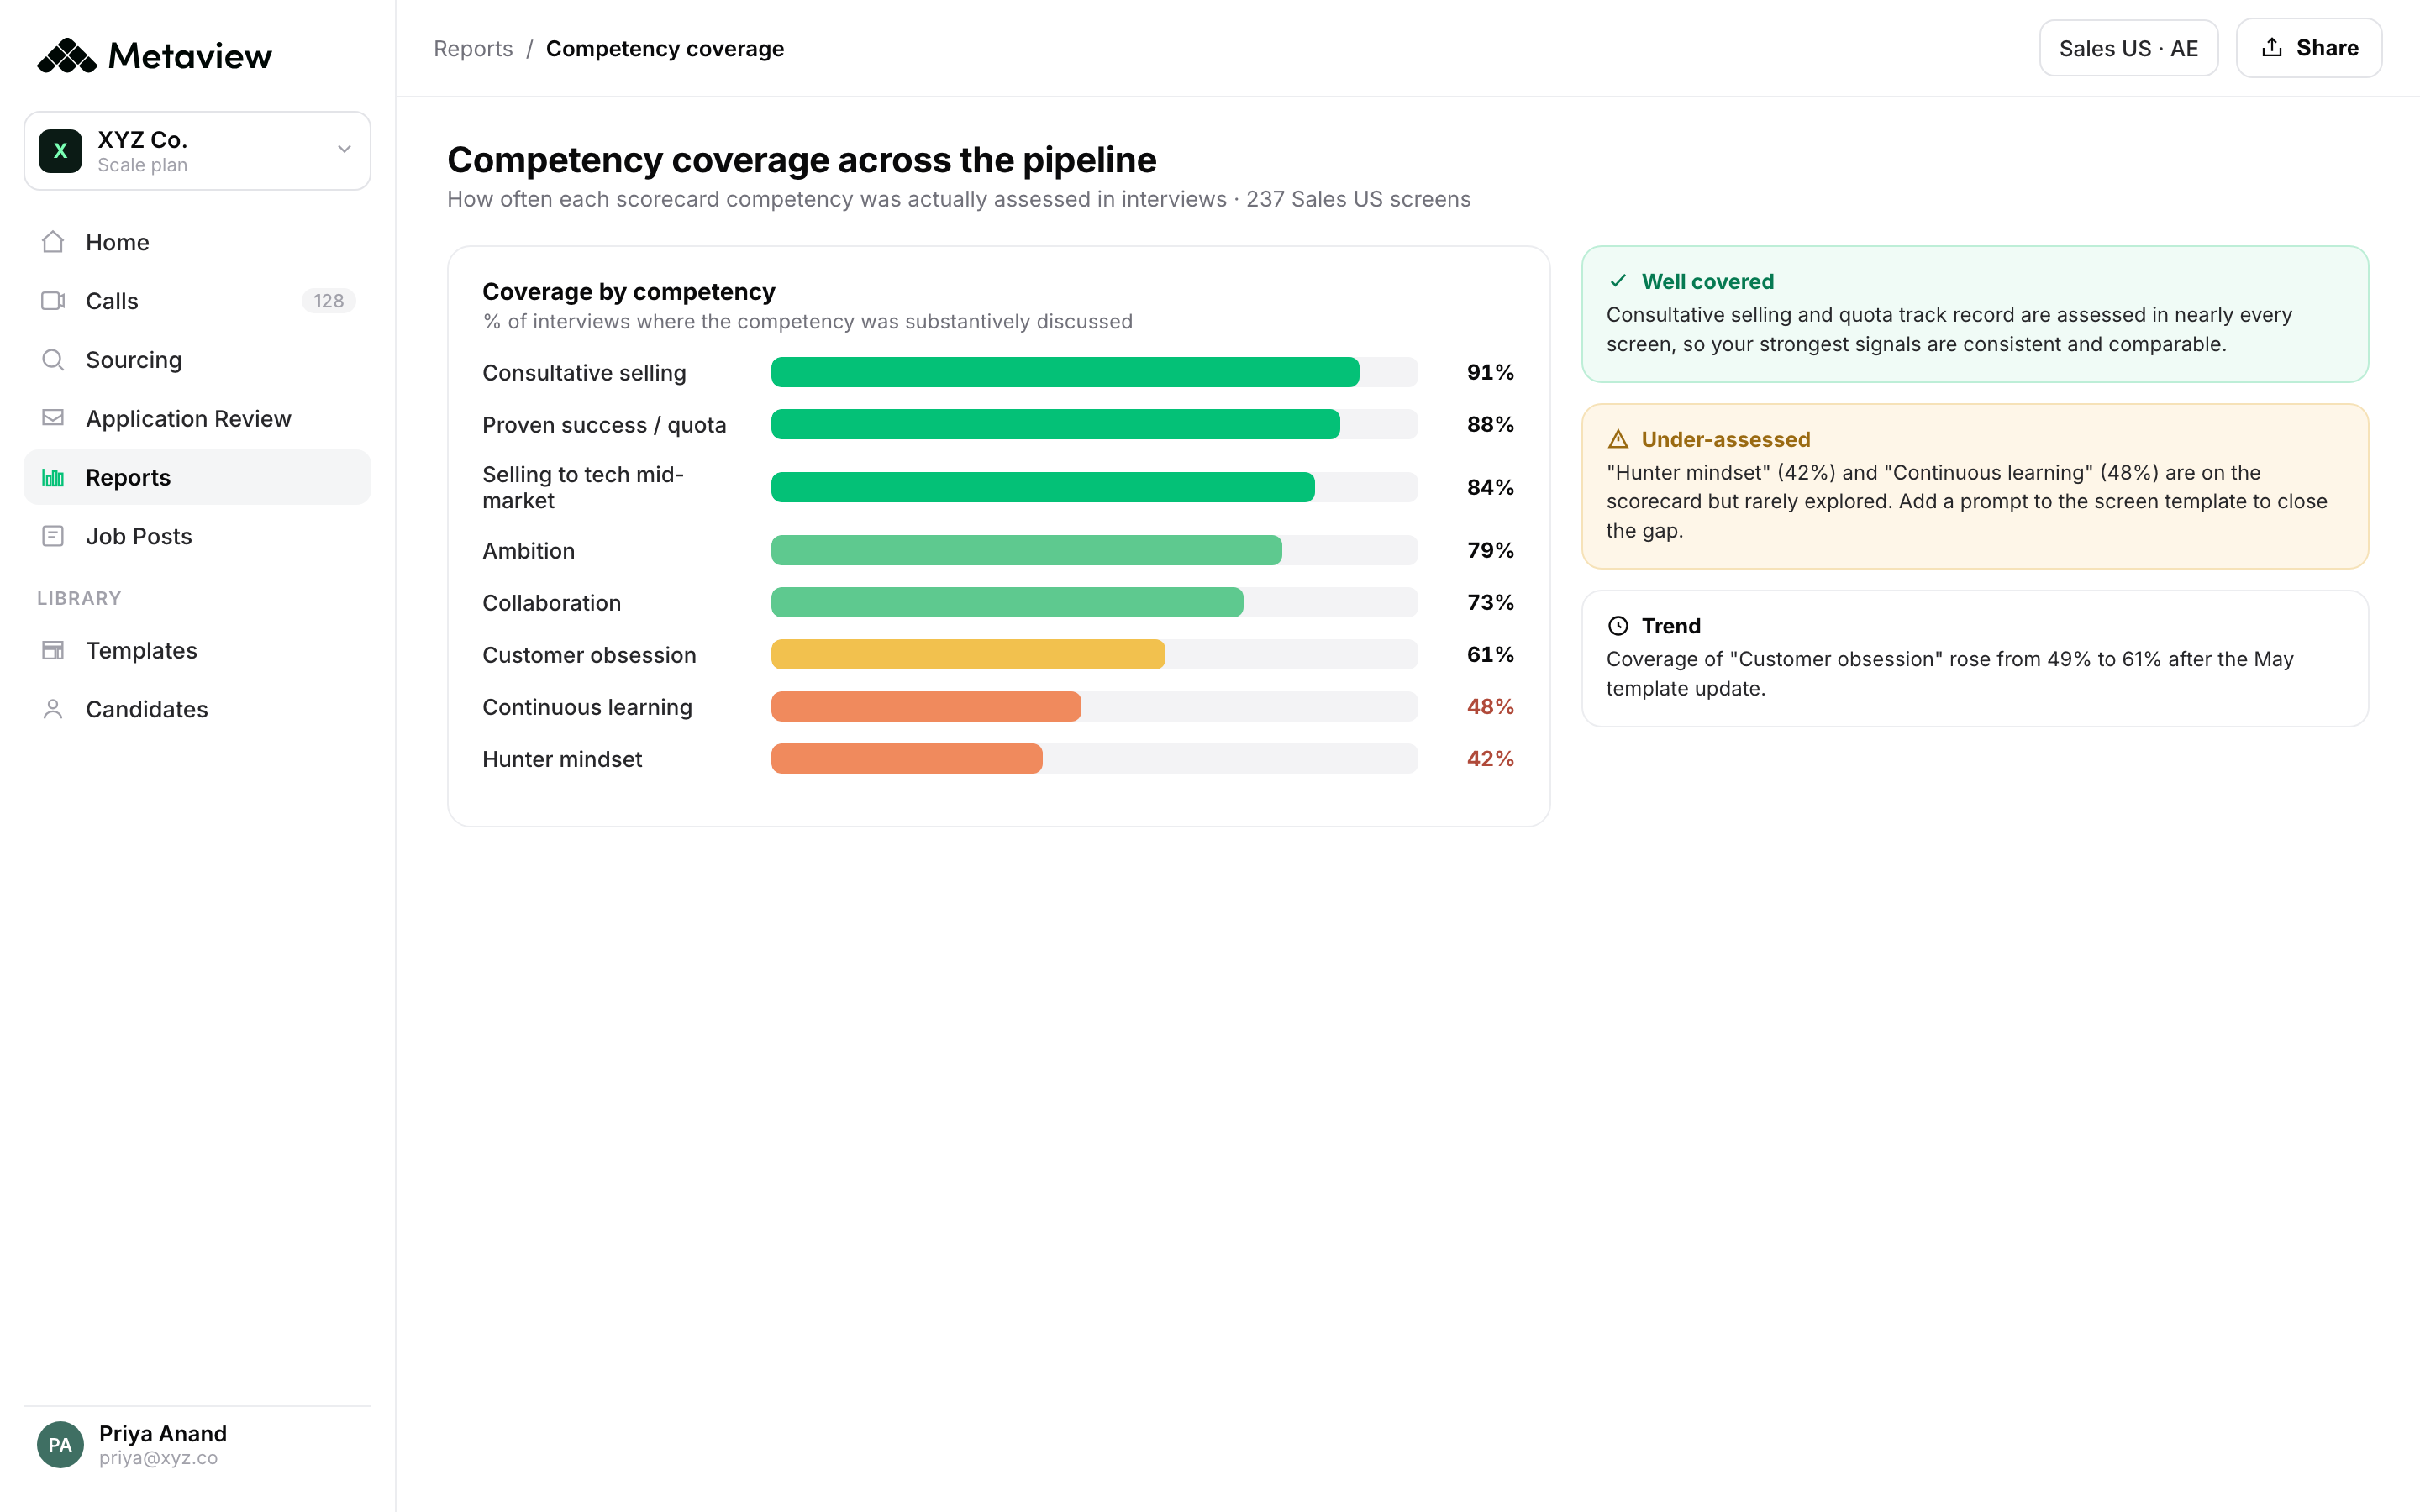
- 1Per-competency capture rates show where the panel is consistently strong or missing signal.
- 2Interview cycle times segment the funnel so you can see where decisions are leaking days.
- 3Hiring-manager satisfaction rolls up by role, surfacing the leading indicator before lagging metrics arrive.
 Stephanie Bowker
Input 4: Hiring-manager confidence as the leading indicator
Hiring-manager confidence is the input most predictive of whether the rest of the model works. The Alignment Report's 3x finding - teams with poor recruiter-HM partnerships are three times more likely to miss business goals - shows what is at stake. Confidence is not a soft metric. It is the leading indicator of whether the hires you make will land.
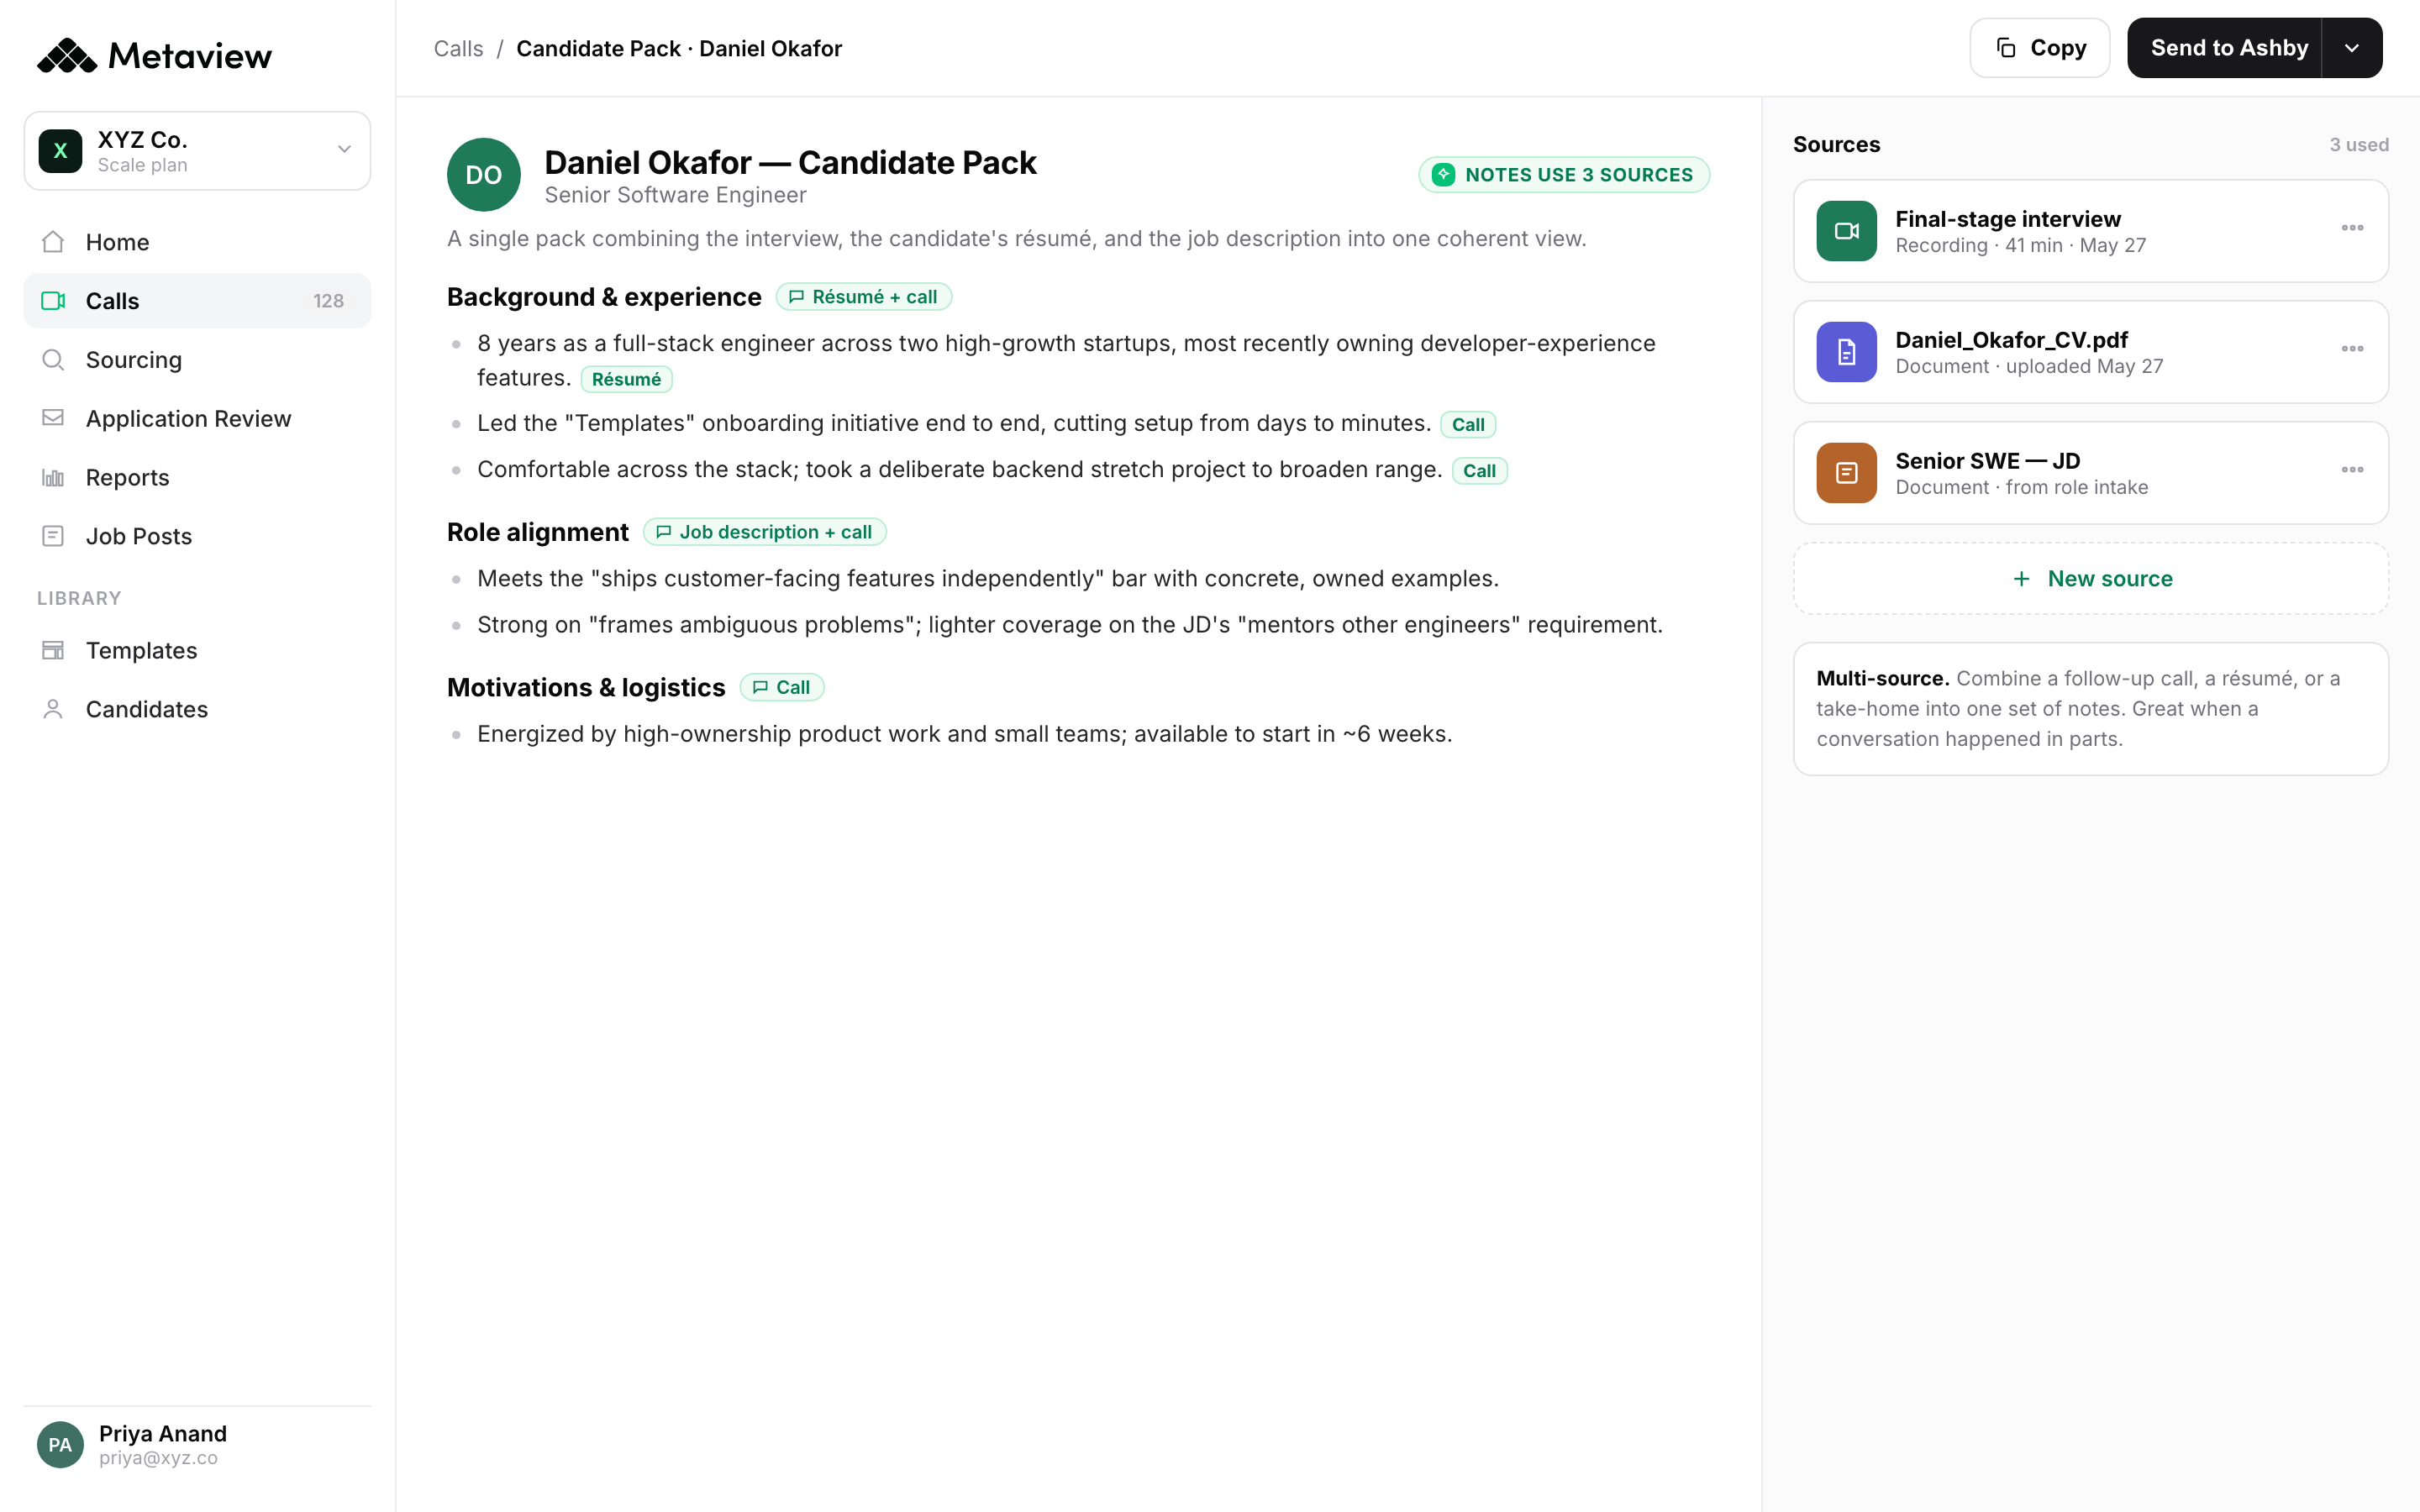
The problem is that “confidence” is hard to capture in a survey. By the time a hiring manager fills in a quarterly NPS, they are reflecting on the hire that already happened, not the process that produced it. The useful signal lives at the seams: how detailed was the intake, did the recruiter understand the role-level competencies, did the debrief surface anything new versus just rubber-stamping the offer.
Capturing those seams gives recruiting a credible answer to the question finance keeps asking. Why should we trust your next hire as much as your last one? When the answer is “here is the data we used to make the call, and here is the hiring manager's signed-off confidence at each stage,” the conversation moves from cost defense to value attribution.
When recruiting partners come to the table with data and insights rather than just candidates, the entire hiring process transforms.”
The 30-day ROI instrumentation plan
The instrumentation does not have to be a year-long program. Most teams can stand up a credible ROI loop in 30 days using the four inputs above. The plan below is the minimum viable version - five workdays per week, no new tooling category, no headcount additions.
- Week 1 - audit the inputs. Pull the last 30 days of interviews, scorecards, and debrief notes. For each, mark whether the four inputs were captured at all. Most teams discover they have speed and cost, half-have quality, and almost-never-have experience or HM confidence.
- Week 2 - close the signal gap. Pick the bottom-quartile interviewers from the audit and onboard them onto a structured-template flow. The aim is not perfection, it is consistency. Every interview from week 2 onward needs to produce competency-by-competency evidence that the next person in the chain can read.
- Week 3 - publish the leading indicators. Build a one-page dashboard with the four inputs, segmented by role and recruiter. Share it with hiring managers before sharing it with finance. The HM feedback in this week is what tells you which metric is the priority to fight for.
- Week 4 - tie it to the P&L. Translate each leading indicator into a dollar number using your existing role-value estimates. Present to finance, not to defend cost-per-hire, but to propose the metric set you will be defending revenue-per-hire on going forward. The shift in framing is the whole point.
Siadhal MagosBring Metaview into your hiring stack.
Live notes, structured scorecards, and ATS sync - set up in under 10 minutes.