
The ATS will give you time to fill. Knowing what counts as good is the harder part.
A 38-day time to fill looks fine on its own and slow next to a competitor closing the same roles in 22 days. A number only means something against a benchmark, and the benchmark has to fit the roles, the level, and the market you hire in.
Below are 14 recruiting benchmarks: what each one tracks, a healthy working range, and what a number outside it usually points to. The ranges are rough starting points that move with industry, role level, and geography, so calibrate them against your own history before anyone is measured on them. For definitions and how to instrument each metric, see the recruitment analytics guide. This post is about what a good number looks like.
All 14 benchmarks at a glance.
| Metric | What it tracks | Healthy range |
|---|---|---|
| Time to fill | Days from req open to offer accepted | 30-45 days (varies by level) |
| Time to hire | Days from candidate apply to offer accepted | 18-30 days |
| Offer acceptance rate | Offers accepted divided by offers extended | 85-95% |
| Funnel conversion | Stage-to-stage candidate progression rates | Application to onsite: 10-20% |
| Quality of hire | Hire performance vs expectation at 6 and 12 months | 75%+ rated meeting or exceeding |
| Source of hire | Hires by channel (referral, inbound, sourced) | Referrals 30%+, sourced 30%+ |
| Cost per hire | Total recruiting spend divided by hires made | $4,000-$15,000 (varies by role) |
| Interview-to-offer | Number of interviews per offer extended | 3-4 interviews per offer |
| Recruiter productivity | Hires per recruiter per quarter | 8-15 hires (varies by role mix) |
| HM satisfaction | Hiring manager NPS or quarterly survey | NPS 30+ or 4.0+ on 5-point |
| Candidate experience | Candidate NPS at offer or rejection | NPS 30+ |
| Active candidates per role | Candidates in pipeline at any time | 15-40 per open role |
| Offer decline rate | Percent of offers declined plus reasons | Under 15% |
| Time in stage | Days candidates spend in each pipeline stage | Under 7 days per active stage |
1. Time to fill.
What it tracks: The number of days from the day a job req opens to the day a candidate accepts the offer.
This is the executive-facing metric every TA leader gets asked about. It's also the metric most distorted by the role level, geography, and seniority. A senior engineering role taking 60 days is normal. A junior CS role taking 60 days is broken.
Healthy benchmark: 30-45 days for individual contributor roles. 45-75 days for managers and directors. 90+ days for VP and exec searches.
2. Time to hire.
The cleaner cousin of time to fill. Time to hire measures from the candidate's first touchpoint (application or sourced contact) to offer accepted, not from req open.
The difference matters because it isolates the part of the process recruiters actually control. Time to fill includes the req-approval delays, headcount lag, and hiring-manager scheduling chaos that aren't recruiter-driven. Time to hire focuses on velocity once a candidate is in the pipeline.
Healthy benchmark: 18-30 days for individual contributor roles, with senior and exec ranges 50-100% longer.
3. Offer acceptance rate.
Offers accepted divided by offers extended. A low offer acceptance rate is one of the clearest signals of a broken upstream process: misaligned compensation, weak hiring manager pitch, slow time-to-offer, or candidate experience that loses people late.
Healthy benchmark: 85-95% for in-house teams. Lower for staffing agencies (where candidate counter-offers from competing employers are common). Anything under 75% means the funnel is either selling the wrong story or vetting the wrong people.
4. Funnel conversion rates.
The percent of candidates who move from one pipeline stage to the next. The most-watched conversion rates are:
- Application to recruiter screen: 10-25% (mostly volume noise filtered out)
- Recruiter screen to hiring manager: 30-50%
- Hiring manager to onsite: 50-70%
- Onsite to offer: 30-50%
The stage with the conversion rate furthest below its range is the bottleneck. Check the middle of the funnel before adding volume at the top: a single broken stage there wastes the applications upstream of it.
5. Quality of hire.
The hardest metric to measure but the only one that ultimately matters. Quality of hire tracks how well hires perform against expectation, typically measured at 6 and 12 months post-start.
The standard input is a hiring manager rating of new-hire performance on a 5-point or banded scale, sometimes blended with retention data, promotion data, and quota attainment for sales roles.
Healthy benchmark: 75%+ of new hires rated as meeting or exceeding expectations at the 12-month mark. Companies in the top decile hit 85%+.
6. Source of hire effectiveness.
Where your best hires actually come from. The big four channels are referrals, inbound applications, recruiter-sourced outbound, and agency placements.
Most teams track this by hire volume but miss the quality lens. Referrals make up 30% of hires for healthy teams, but the more important number is quality of hire by source. Referrals consistently outperform inbound on 12-month retention and quality-of-hire scores.
Healthy benchmark: Referrals 30%+ of total hires, sourced outbound 30%+, inbound applications under 35%.
7. Cost per hire.
Total recruiting spend divided by number of hires. Includes recruiter salaries (loaded), tooling, ATS fees, sourcing tools, job board spend, employer brand, and agency fees.
This is the finance-facing metric. It varies dramatically by role and channel.
Healthy benchmark: $4,000-$5,000 per hire for high-volume frontline. $8,000-$15,000 for mid-market knowledge work. $25,000+ for senior tech and exec searches. Agency-placed roles can run $30,000-$80,000+ depending on contingency or retained terms.
8. Interview-to-offer ratio.
How many interviews you run per offer extended. A high number means the process is over-interviewing low-fit candidates. A low number means the screening upstream is doing its job.
Healthy benchmark: 3-4 interviews per offer. Anything above 6 is over-interviewing; the screening before the loop isn't filtering well. Anything below 2.5 might mean the loop is too lenient (offers going to candidates who shouldn't have made it through).
9. Recruiter productivity.
Hires per recruiter per quarter or per year. The mix matters more than the headline number: a recruiter closing 30 SDR hires per quarter is doing different work than one closing 4 staff engineers.
Healthy benchmark: 8-15 hires per recruiter per quarter for in-house teams running a mixed pipeline. 25-40 per quarter for high-volume frontline. 4-8 per quarter for senior tech, GTM, or exec roles.
10. Hiring manager satisfaction.
How satisfied hiring managers are with their recruiter, the candidates presented, the speed of the process, and the quality of the hire. Measured via quarterly NPS or 5-point survey.
This is the internal-customer metric. Low scores predict downstream pain: hiring managers stop using the TA team and start sourcing their own candidates or pushing for agency spend.
Healthy benchmark: NPS 30+ or 4.0+ on a 5-point scale across the function.
11. Candidate experience (NPS).
How candidates rate their experience, surveyed at the offer stage and at the rejection stage. The rejection-stage measurement is the real signal: a candidate who declines and still gives a 7+ NPS is a candidate who will refer friends.
Healthy benchmark: NPS 30+ at offer stage, 0+ at rejection stage. Top-decile teams hit 50+ at both.
Most candidate-experience problems show up here as drops in NPS at specific stages: the screening call, the take-home, or the final-round debrief response. Pair this metric with funnel conversion to find where the experience breaks.
12. Active candidates per role.
How many qualified candidates are in the pipeline at any given moment. Reps the "pipeline coverage" health of each open req.
Healthy benchmark: 15-40 active candidates per open role for in-house teams. Below 10 means the role is undersourced and at risk; above 60 usually means the recruiter is screening too widely without disqualifying.
13. Offer decline rate and reasons.
The flip side of offer acceptance. More valuable than the raw rate is the breakdown of decline reasons: compensation, counter-offer, role scope, manager fit, growth path, location.
Track this every quarter and compensate for the recall bias. Candidates rarely tell recruiters the real reason at the moment of decline. The pattern emerges across the dataset.
Healthy benchmark: Under 15% offer decline rate. Compensation-driven declines should be under 30% of the decline reasons; if compensation is the leading cause, the offers are being made wrong.
14. Time in stage.
The number of days candidates spend in each pipeline stage. Distinct from time to fill, which is the total. Time in stage exposes which specific step is slowing the loop down.
The most common culprits are "awaiting hiring manager feedback" and "scheduling onsite." Both are interview-loop coordination problems, both are solvable with structured interviewer commitments and modern scheduling tools.
Healthy benchmark: Under 7 days per active pipeline stage. Stages where candidates routinely sit 14+ days are the friction points.
How Metaview helps you hit these benchmarks.
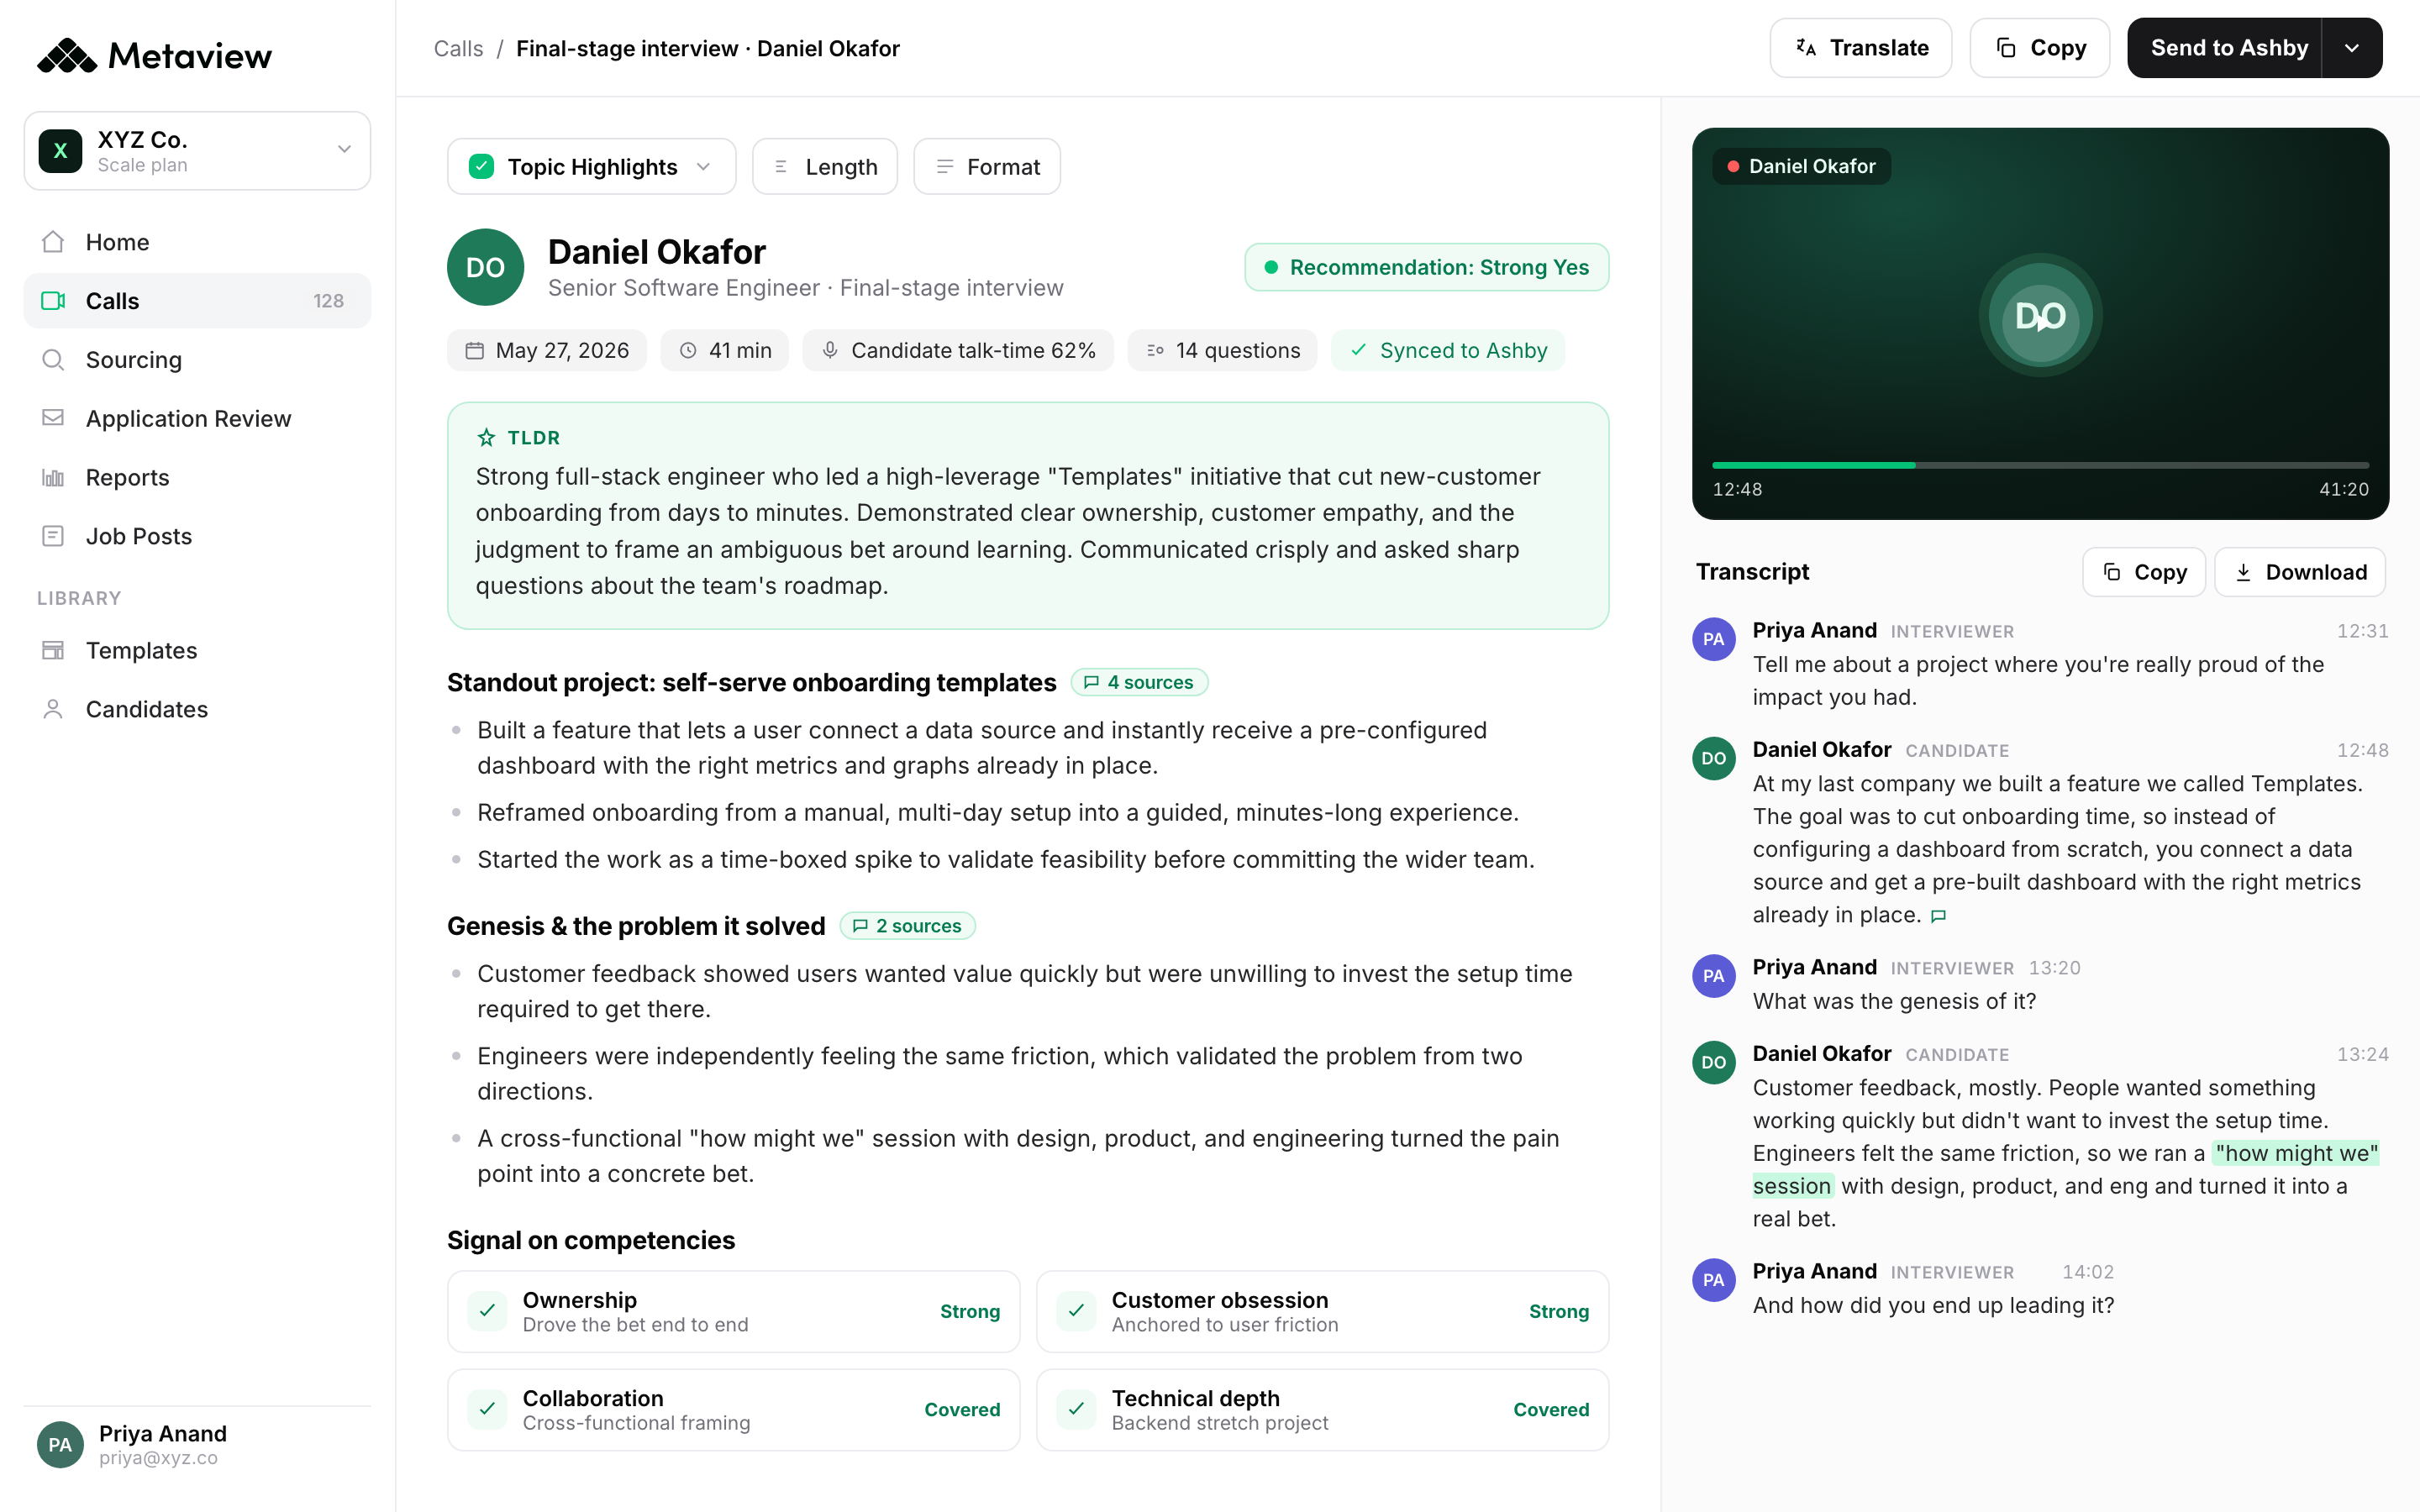
Three of these benchmarks lean on a record that's easy to keep badly: what was said in each interview, and what every interviewer concluded from it. Interview-to-offer ratio, time in stage, and the onsite-to-offer step of the funnel are all easier to diagnose once every interview is recorded and scored on the same rubric, and hiring manager satisfaction is easier to move when the panel argues from the same evidence.
Metaview's Notetaker joins each interview as a visible participant, records it, and transcribes it. The Notetaker then drafts the scorecard for the interviewer to review and submit, and Metaview Reports lets you query the team's own interview data: themes across a set of interviews, how long interviews run, and whether scorecards got submitted.
Metaview holds no post-hire data, so quality of hire stays a hiring manager rating, and offer, cost, and source numbers still come from the ATS and finance. The interview record gives you the evidence behind the three benchmarks above, and the debrief starts from what was said rather than from what each interviewer remembers.
What you get on day one:
- Live capture across Zoom, Google Meet, Microsoft Teams, Webex, and phone.
- Structured notes from every interview and a scorecard draft mapped to your rubric.
- Reports across your own interview data, in the product and through the Metaview MCP.
- Scorecard submission straight into Ashby and Lever; for Greenhouse, the browser extension autofills the objective fields and the interviewer completes the rest. Support for other systems is covered in the ATS integrations guide.
- A free tier to start, and paid plans priced per agent. See pricing.

We used Metaview Reports to identify themes across the interviews. The habits, behaviors and skills top performers bring to the table that make them the best at what they do.”

Bring Metaview into your hiring stack.
Live notes, structured scorecards, and ATS sync - set up in under 10 minutes.
Frequently asked.
What are the most important recruiting metrics to track?
Five carry most of the weight: time to fill, offer acceptance rate, quality of hire, funnel conversion, and candidate experience NPS. Start with those, get clean data on each, then add the other nine for diagnostic depth.
What's a good time to fill?
30-45 days for individual contributor roles. 45-75 days for managers and directors. 90+ days for VP and exec searches. Measure from the day the req opens, and report it by level so one long executive search doesn't drag the average for the whole team.
What's the difference between time to fill and time to hire?
Time to fill measures from req open to offer accepted. Time to hire measures from candidate first touchpoint (apply or sourced) to offer accepted. Time to hire isolates the recruiter-controllable part of the process; time to fill includes req approval and headcount lag.
How do you measure quality of hire?
The standard input is a hiring manager rating of new-hire performance at 6 and 12 months on a 5-point scale. Blend in retention data and, for sales roles, quota attainment. Keep the interview evidence (scorecards and notes) so a 12-month rating can be read against what the panel saw at the time.
How often should recruiting metrics be reviewed?
Weekly for time in stage and funnel conversion. Monthly for time to fill, offer acceptance, recruiter productivity, and candidate experience. Quarterly for quality of hire, hiring manager satisfaction, source of hire, and cost per hire.
Do recruiting benchmarks vary by industry?
Yes. Industry, role level, and geography all move the ranges: a senior engineering search and a frontline retail hire aren't comparable on time to fill or cost per hire. Use the ranges in this article as starting points and calibrate against your own historical data.


